Musings from Past: Writings From my School Magazine
Prelude
Animation is a method in which figures are manipulated to appear as moving images. In traditional animation, images are drawn or painted by hand on transparent celluloid sheets to be photographed and exhibited on film. Today, most animations are made with computer-generated imagery. Wikipedia
So basically what we need to do is create a sequence of multiple images appearing one after another.
This can be translated basically in pseudocode as:
( Human eyes percieve >=30 frames/picture per second as fluid motion/video i.e. the animation does not appear jaggy if the frames per second is more than equal to 30.)
So Python has multiple libraries and methods to animate things. I’ll address methods which do not require any extra installations or modules and very basic things.
This works in any IDE( Spyder, Python3, etc) and Jupyter Notebooks, basically any offline way to do python.
If your graphs do not appear in a different window like this:

Type %matplotlib qt5 on the console of your IDE or in a code cell of Jupyter Notebook.
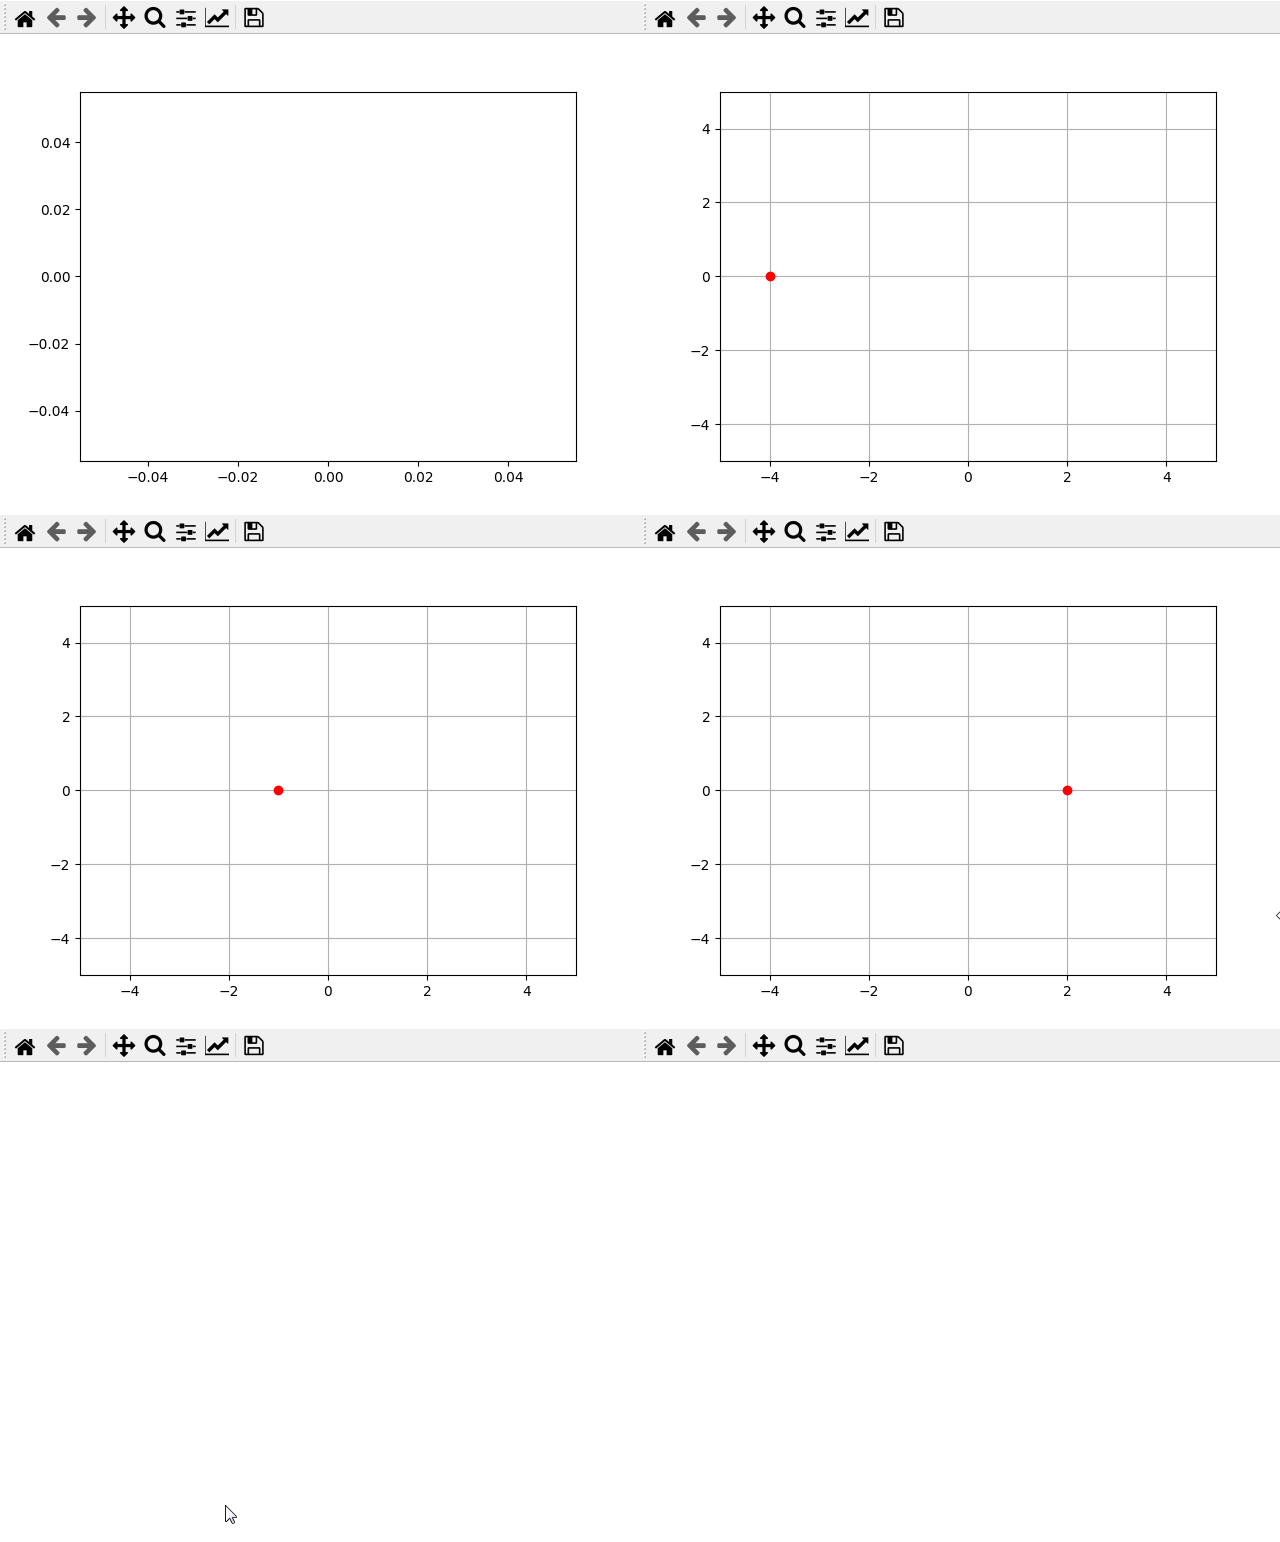
Here’s a simple example:
%matplotlib qt5
import numpy as np
import matplotlib.pyplot as plt
for i in range(-4,4):
    plt.grid(True)#showing gridview for better viewing

    # we need to set a strict frame so that the view does not change for each loop
    plt.xlim(-5,5)
    plt.ylim(-5,5)


    plt.plot(i,0,'ro')#plotting a red dot

    plt.pause(0.2)#pausing for 0.2 seconds

    plt.clf()#clearing the frame
You can see the output below:

You could increase the number of loops,decrease the distance between the points or decrease the pause time to make the animation more fluid. (Think of a flipbook animation for analogy and proper mindset.)
This method requires you to install and additional module ffmpeg-python which compiles a series of images into a video file. Here’s an example (Click This!).
You can always Google your way into knowing and exploring more.
This is an inbuilt way to do animation, though it’s a bit cumbersome, it works great when you get it right and can be used in even online notebooks like Google Colab
from matplotlib import pyplot as plt
import numpy as np
from matplotlib.animation import FuncAnimation

# initializing a figure in
# which the graph will be plotted
fig = plt.figure()

# marking the x-axis and y-axis
axis = plt.axes(xlim =(-4, 4),ylim =(-1,15))

# initializing a line variable
line, = axis.plot([], [], lw = 3)

T=np.array([[-1,0],[0,1]])
pt=np.array([1,5])

# this is the main function which takes in a frame number and returns the new data values
def animate(i):
    if i>200:
        axis.plot(pt[0],pt[1],'bo')
        axis.annotate(str(pt)+'Original Point',(pt[0],pt[1]+0.5))

    if i>250:
        tr=np.dot(T,np.transpose(pt))
        axis.plot(tr[0],tr[1],'go')
        axis.annotate(str(tr)+'Reflected Point',(tr[0]-0.2,tr[1]-0.5))

    if i<=200:
        y = np.linspace(0,10*i/200, 1000) # since is frame number max val of i is 300 thus the size of
        x = np.zeros_like(y)             # y keeps increasing with frame till 2/3rd of the total animation

        line.set_data(x, y)

    return line,

anim = FuncAnimation(fig, animate,frames = 300,interval = 20)

# interval is 20 millisecond thus in one second number of frames = 1/0.020= 50 frames/sec
# to save as a video file
anim.save('animation.mp4',writer = 'ffmpeg', fps = 50)
# to show the animation
# Only works in Notebooks like Jupyter and Colab
from IPython.core.display import HTML
HTML(anim.to_html5_video())
Here’s a great tutorial too , and again Google.
Note: widgets only work in notebook environment like Jupyter or Google Colab.
Here’s my program for transformation of matrices. You can download this too by going to the file tab in Colab Notebook and use in local Jupyter Notebook.
Shantanu Dash